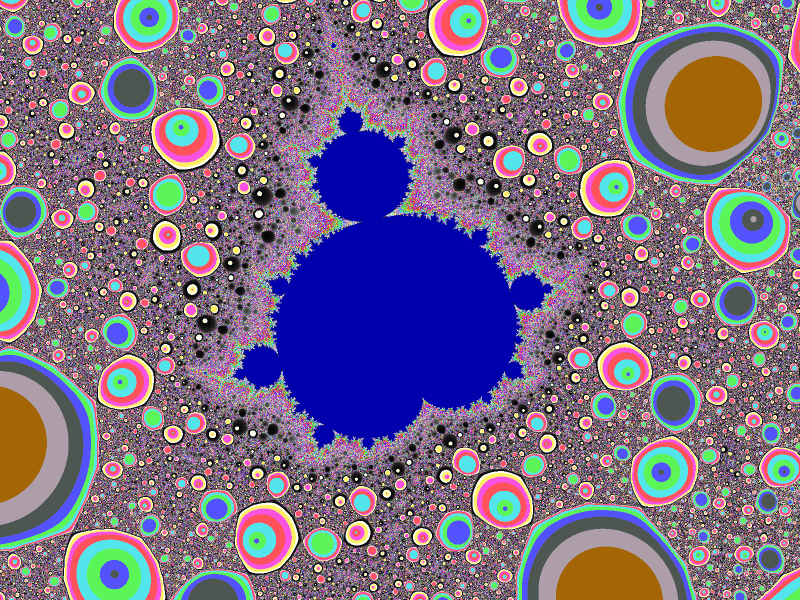
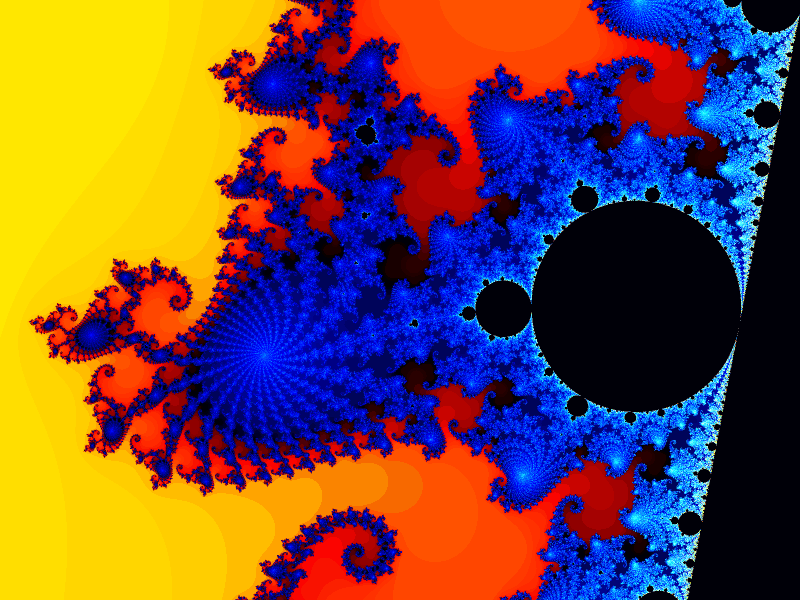
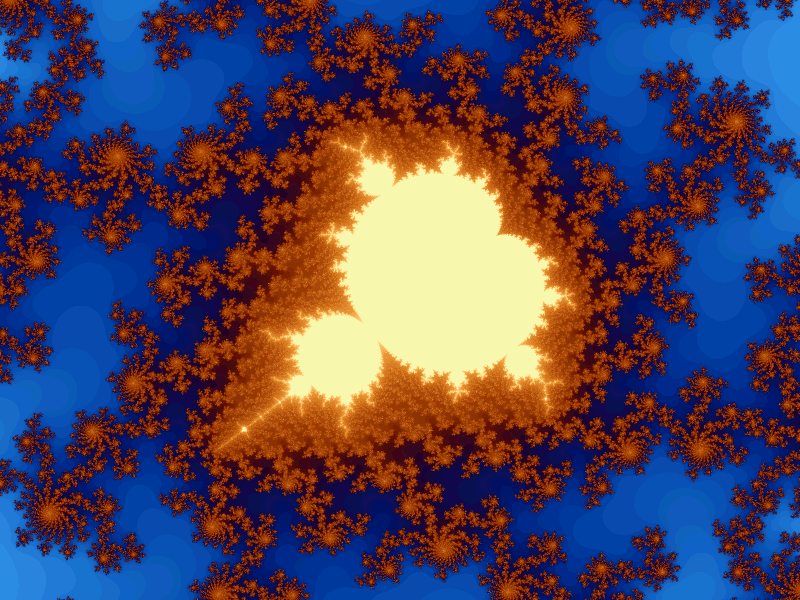
A while ago, I discussed a data structure which makes real-time Mandelbrot zooming possible. I finally got around to implementing it and the result is here (source code). Windows only for now, but it could be ported to other platforms with some effort.
As well as real-time zooming, the program has a logarithmic palette, progressive resolution, progressive dwell limit and anti-aliasing.
The program should run on Windows 98 or later and has no dependencies. It uses GDI for drawing - DirectX is not needed. It'll work best if your video mode is set to 32-bit colour depth. It's reasonably fast on my 2GHz Core Duo machine (even though it only uses one core at the moment), but the faster your machine the better. It can be a bit memory hungry (I've seen it use over 200Mb for a detailed 1600x1200 image).
The program is controlled with the mouse - hold down the primary button to zoom in, the secondary button to zoom out and drag with the middle button to pan. I was surprised to learn after implementing them that they are exactly the same as for XaoS. I'd like to think that it's convergent evolution but I probably just subconsciously remembered them from the previous time I used XaoS some months previously.
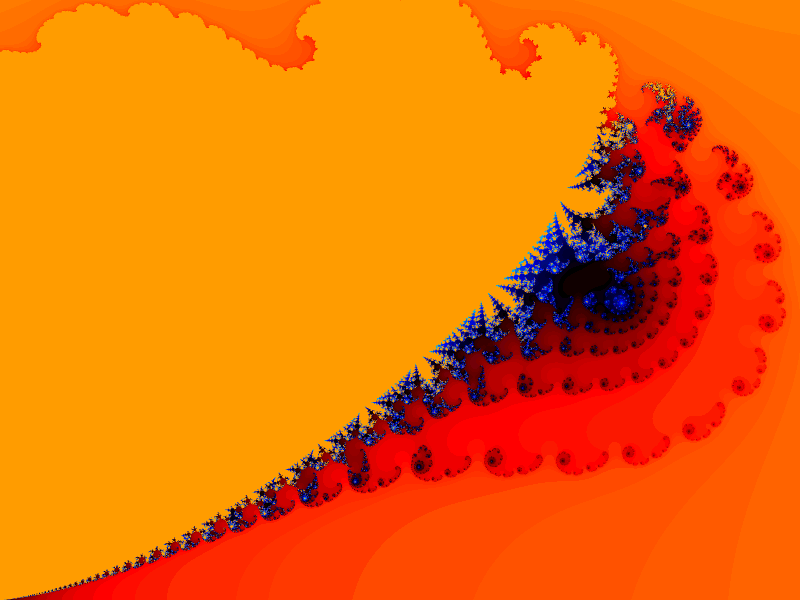
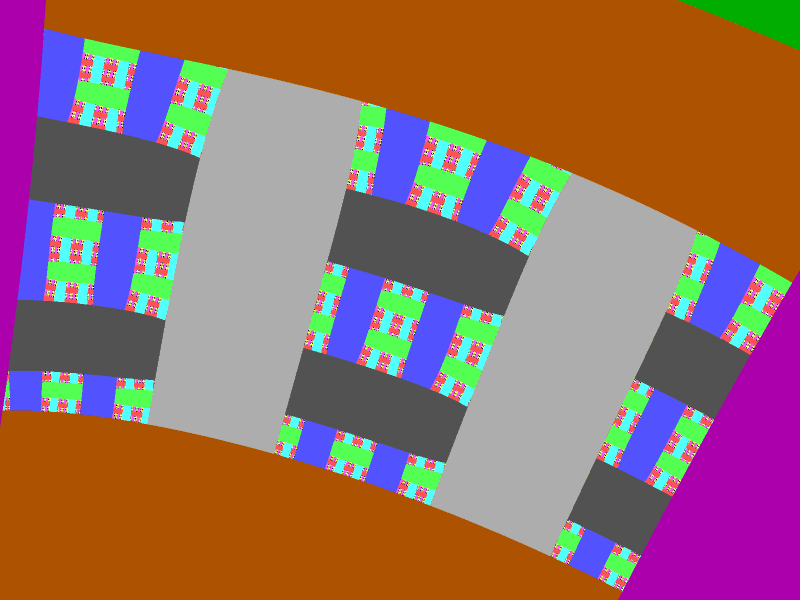
If you zoom in too far (by a factor of 30 billion or so) you'll reach the limit of double-precision arithmetic and the image will dissolve into rectangles. Eventually I plan to implement multiple precision arithmetic which will make it possible to zoom in much further. Though there will always be a practical limit of just how long it takes to multiply two numbers of sufficient precision.
If you leave it for a while without zooming it will gradually refine the image to sub-pixel level and make some really gorgeous images. It will calculate faster if the window is covered up - redrawing is quite slow, especially once the image is quite highly refined. This is also why the zooming is a bit jerky if you leave it for a while. I'm thinking of ways to improve the rendering speed - I'm wondering if I can do better (at least for highly refined areas) by rendering to a grid-aligned array first and then resampling, instead of rendering each block directly.
I've experimented with SOI (using linear interpolation and a quadrilateral method for divergence detection) but so far it doesn't seem to make much difference (though the fact that it doesn't slow things down terribly is encouraging). This version doesn't include those experiments. Perhaps I need to use a higher-order method. AlmondBread and Fractint use quadratic interpolation. I'm wondering if better results can be achieved by iterating some derivatives of the Mandelbrot formula instead of extra points. Then I wouldn't need to interpolate at all - just evaluate the Taylor expansion when I need to subdivide. And divergence detection would just be a matter of looking at the highest order derivative.

")

")
")
 and
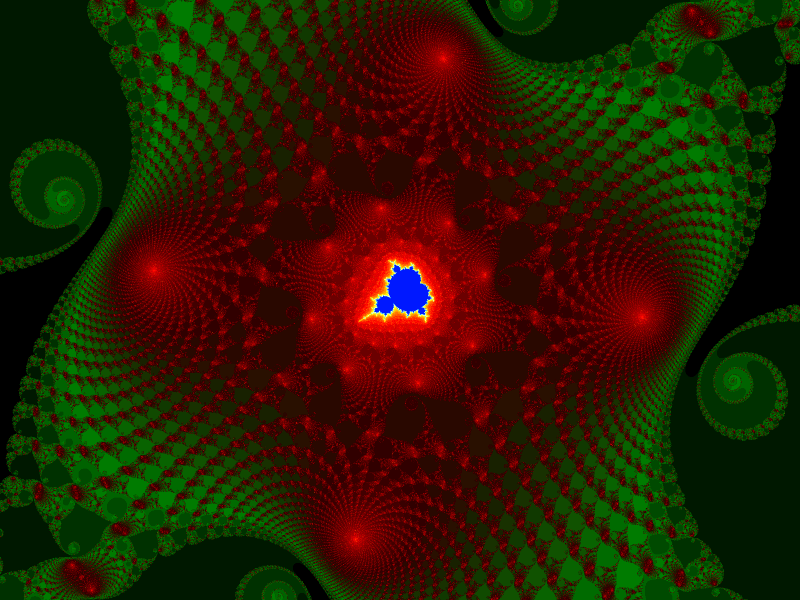
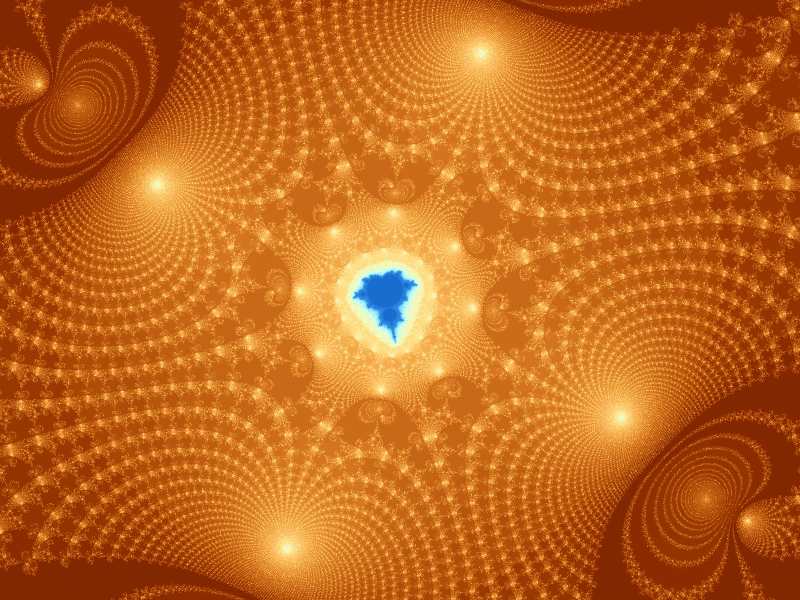
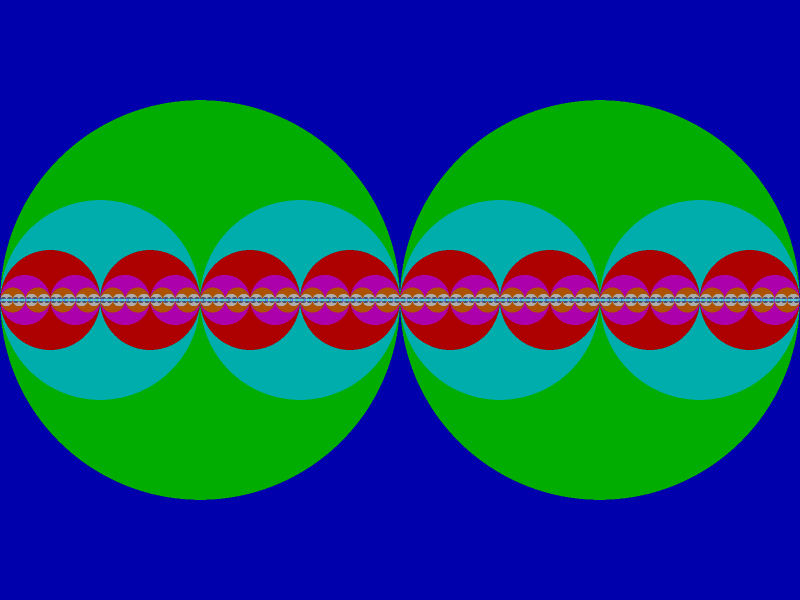
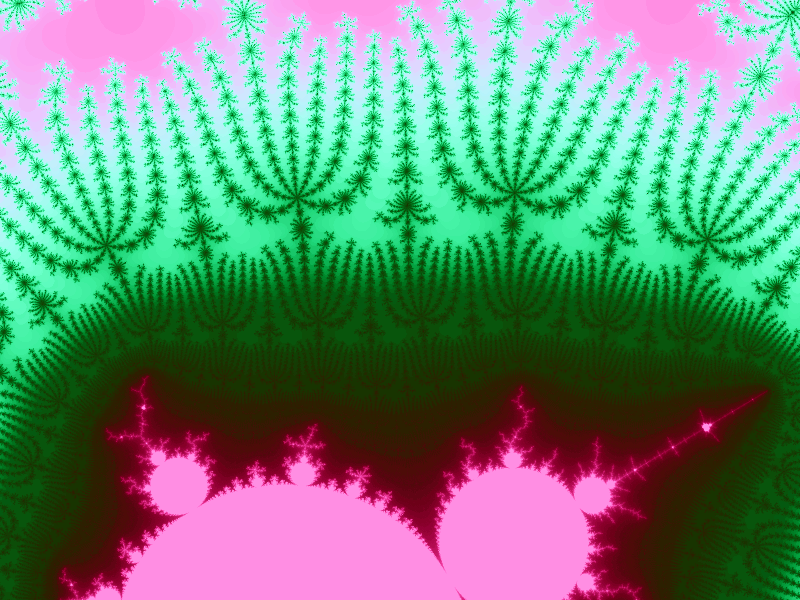
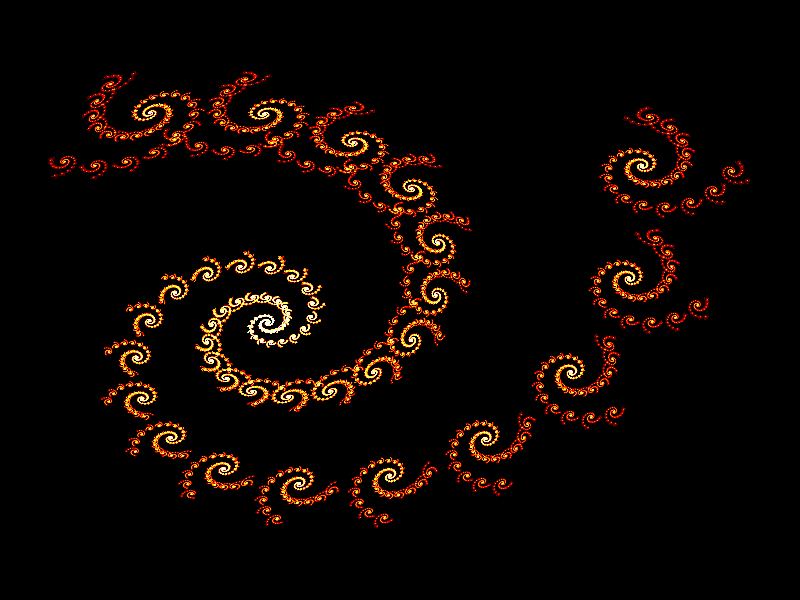
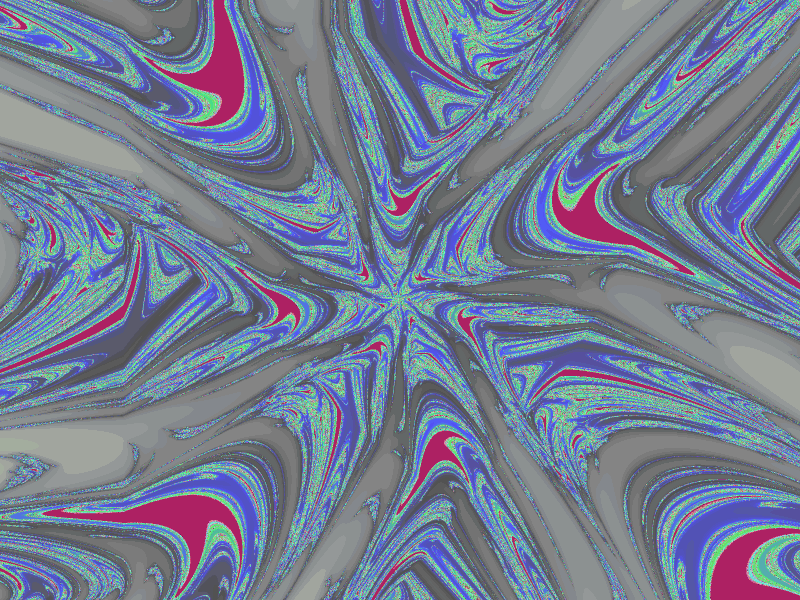
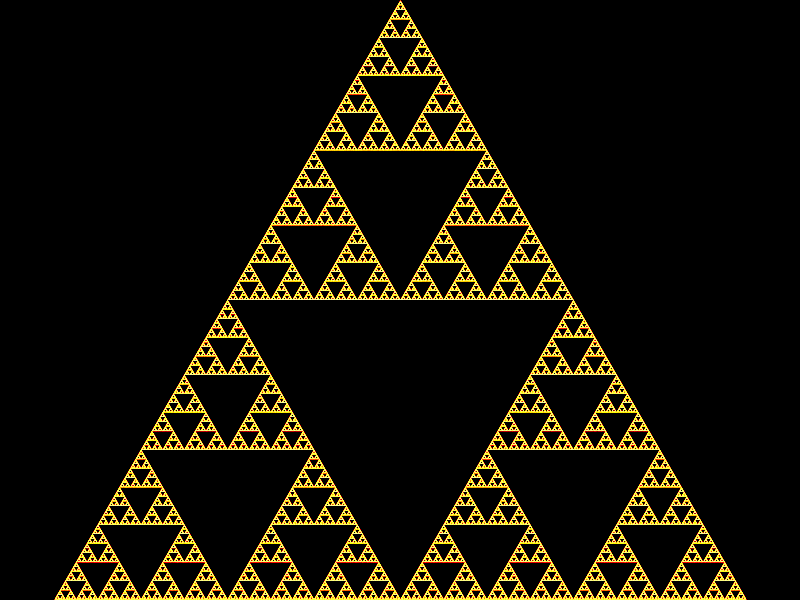
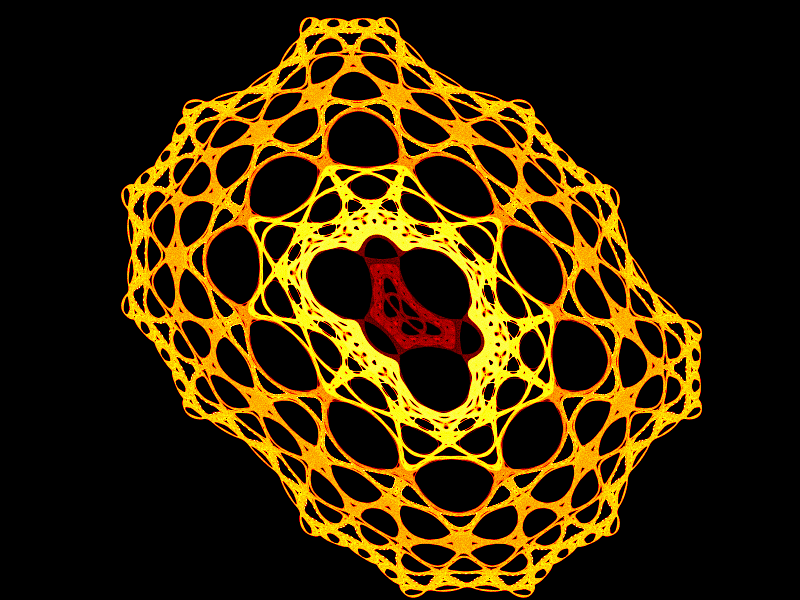
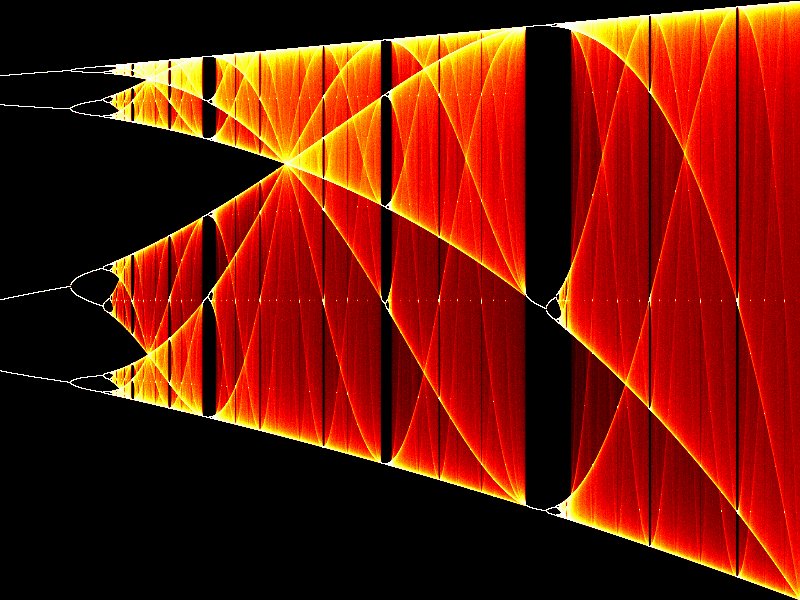
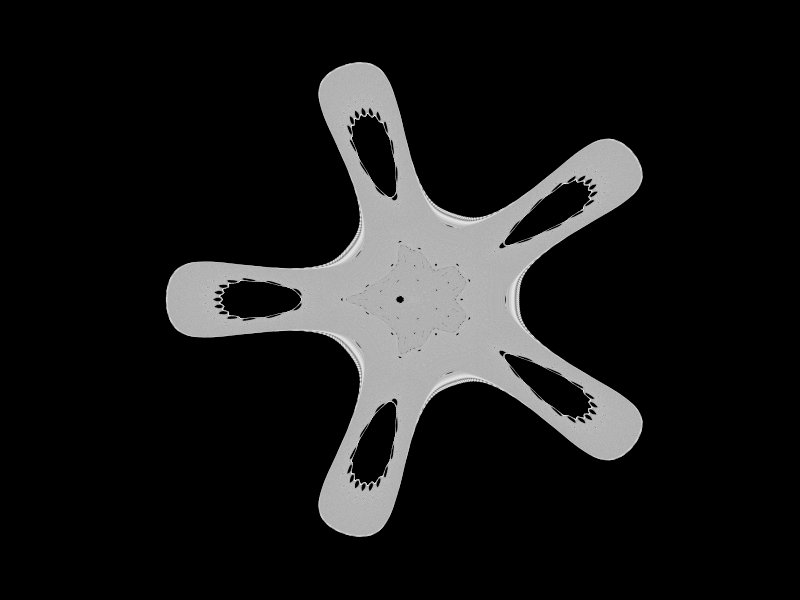
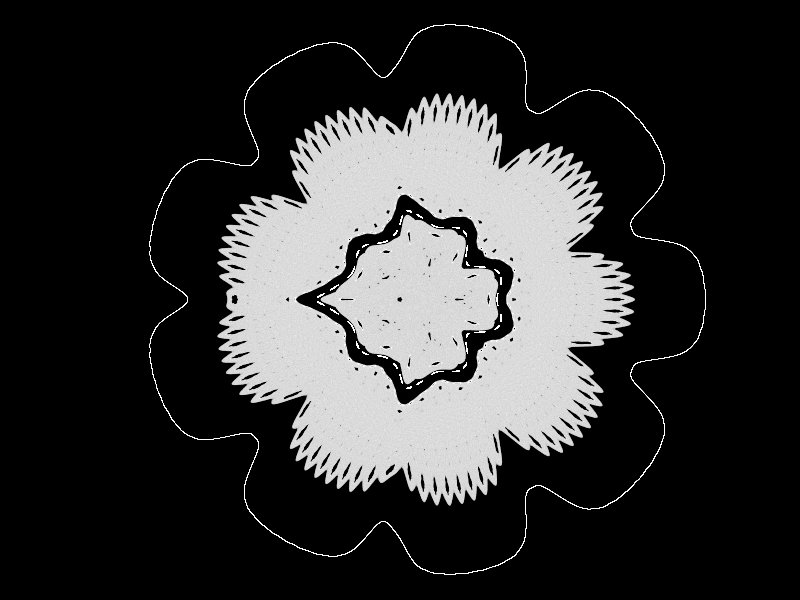
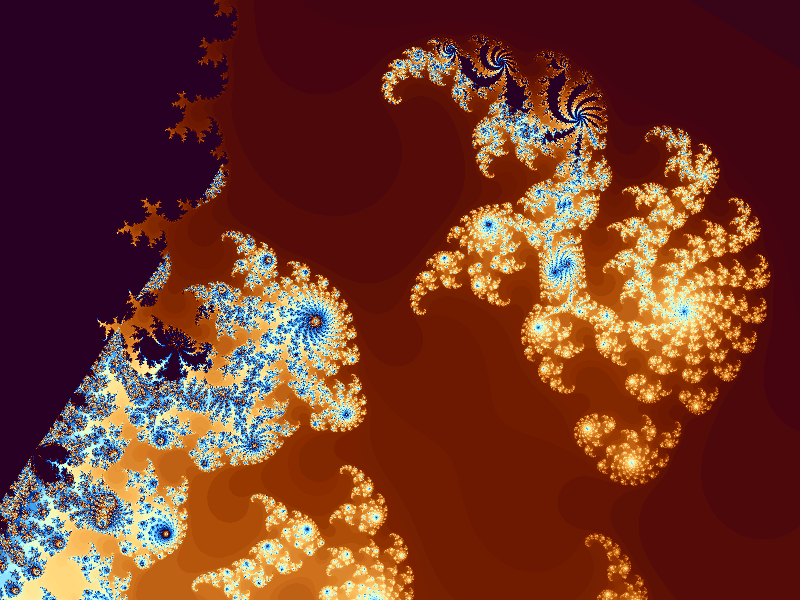
and  are easy to draw because they just involve complex addition and multiplication. What happens if we try to generalize these sorts of fractals to non-integer powers?
^w = e^{w\frac{\log z}{\log e}}")
")
}")
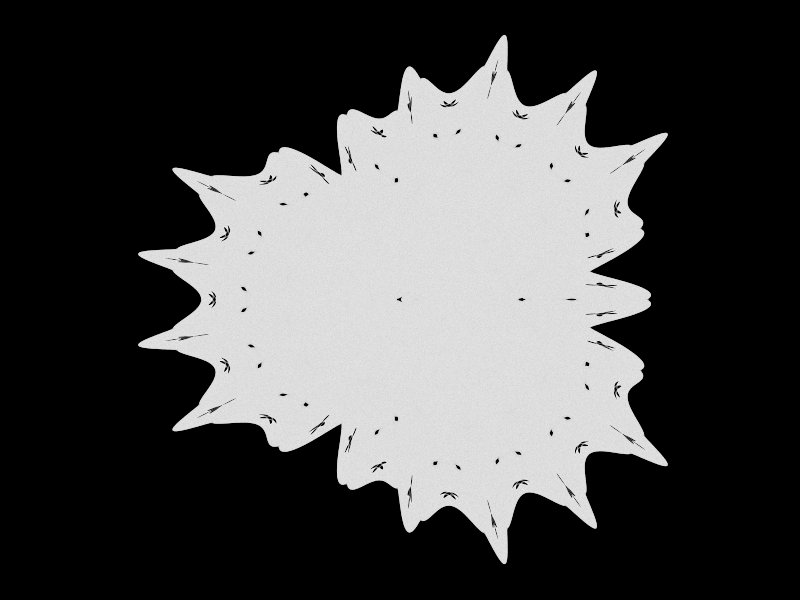
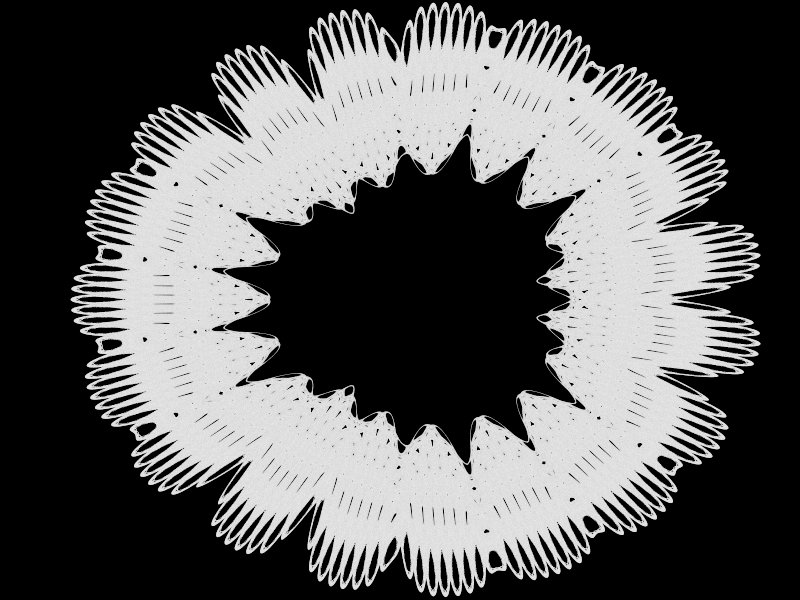
 . Given a parameter
  we can pick
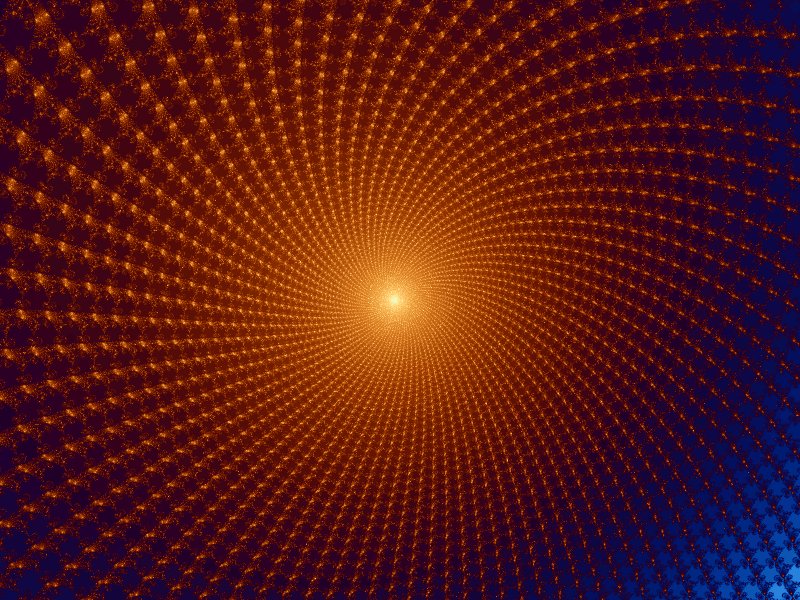
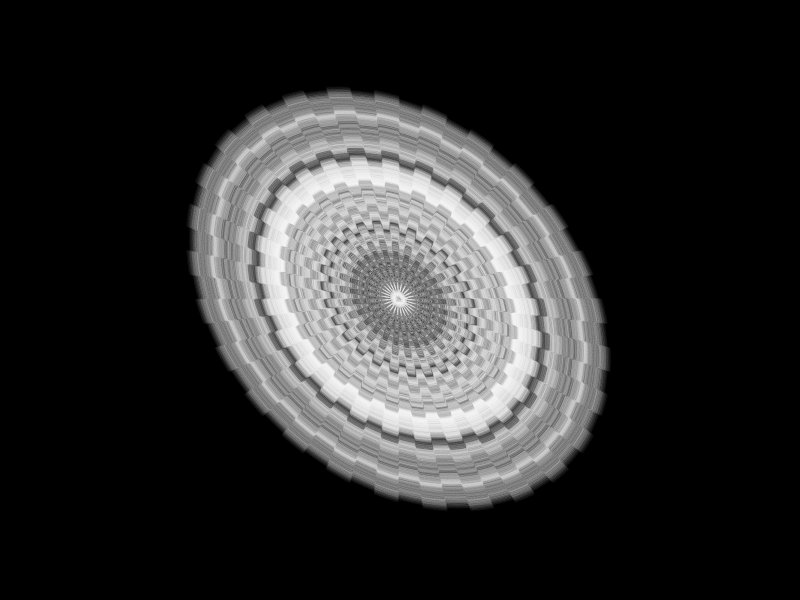
  + 2n\pi < \theta + \pi") (i.e. choose a branch cut of constant argument and a sheet of the Riemann surface):
(i.e. choose a branch cut of constant argument and a sheet of the Riemann surface): }{\pi} + 1)\rfloor") . Then as we gradually vary
. Then as we gradually vary  ,
,  , increasing
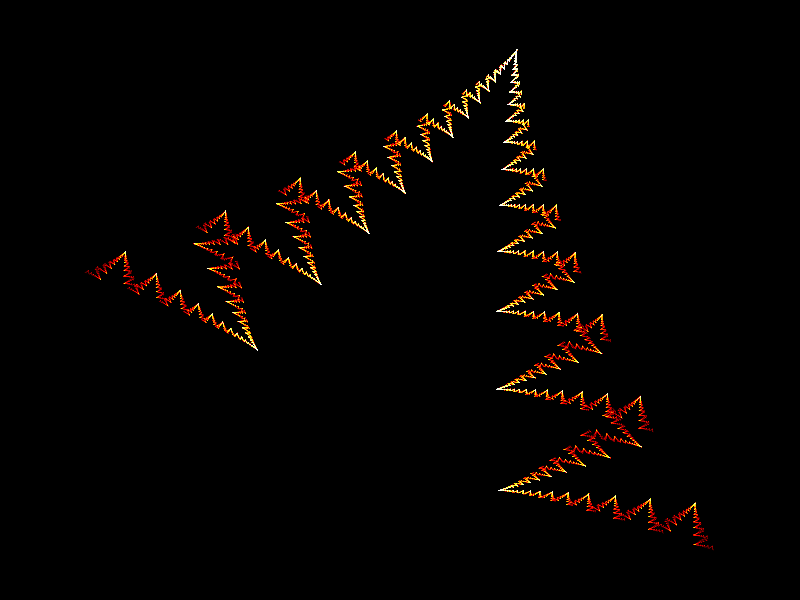
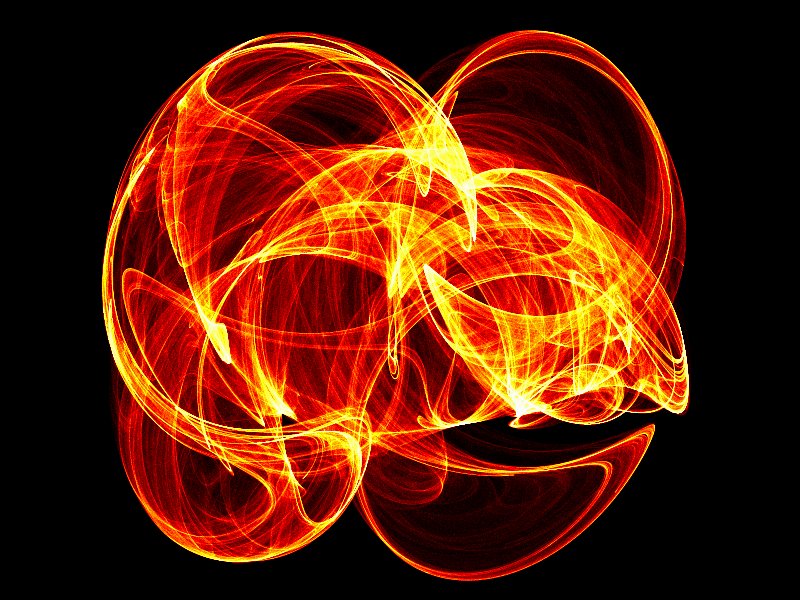
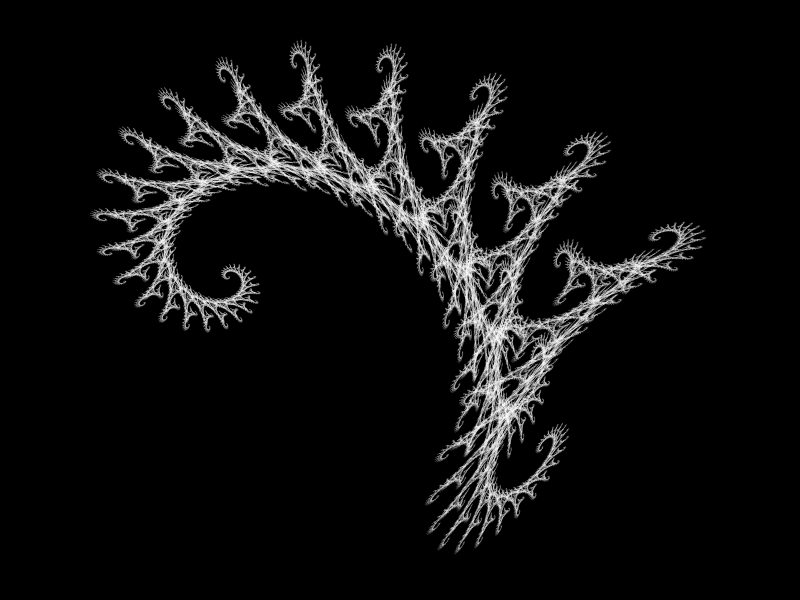
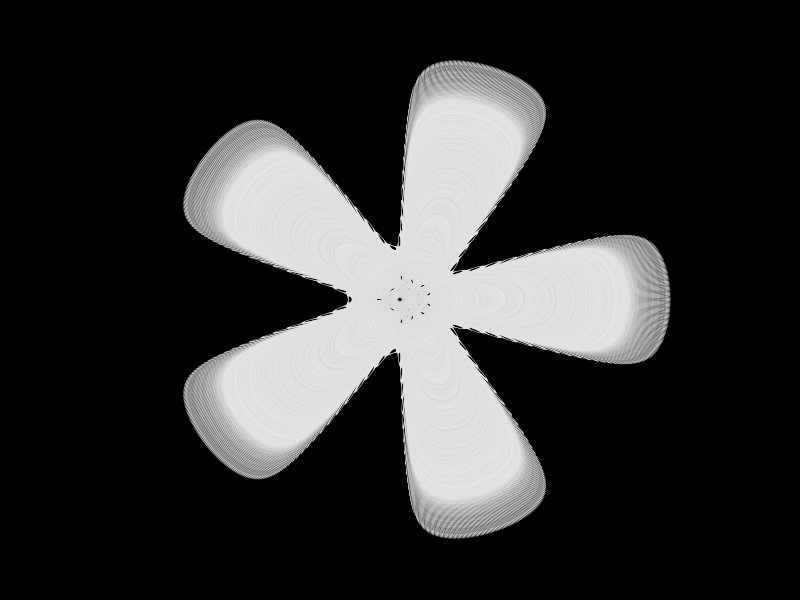
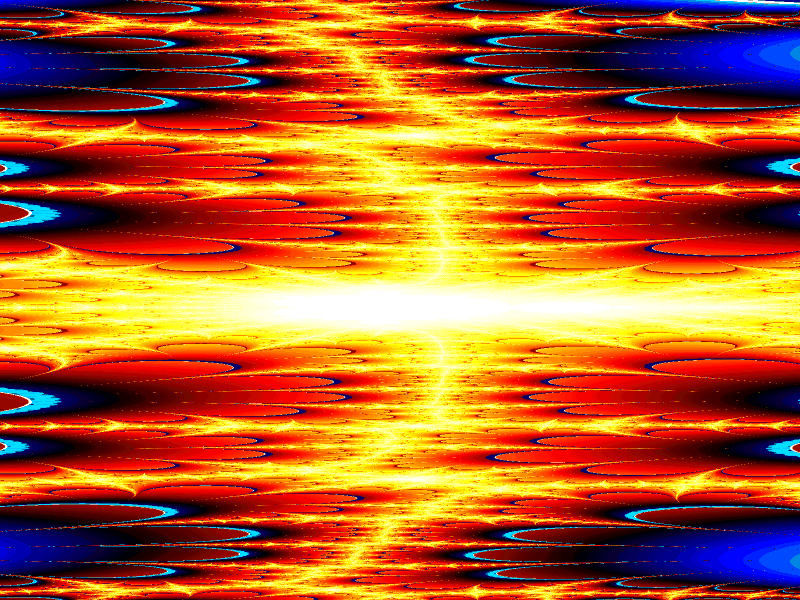
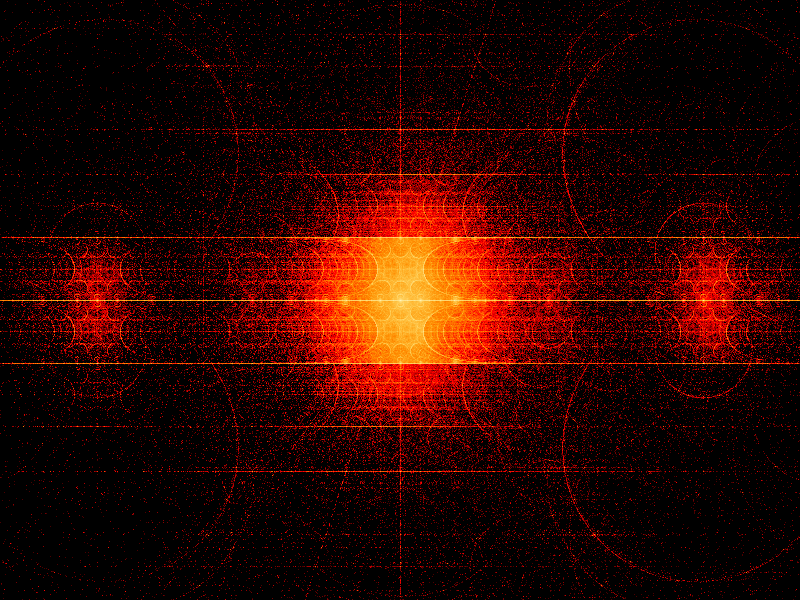
  to "spiral in" from infinity towards the origin (
 ) or out (
 ). When
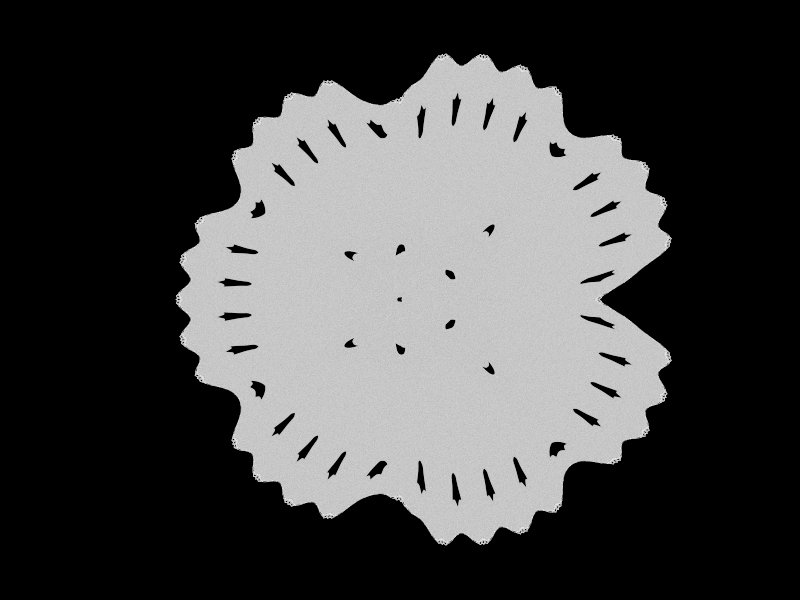
  , increasing
  .
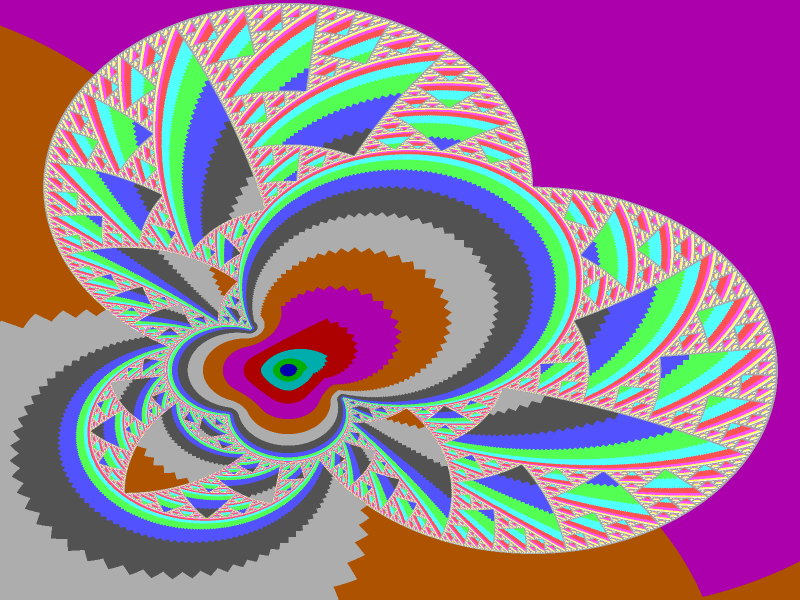
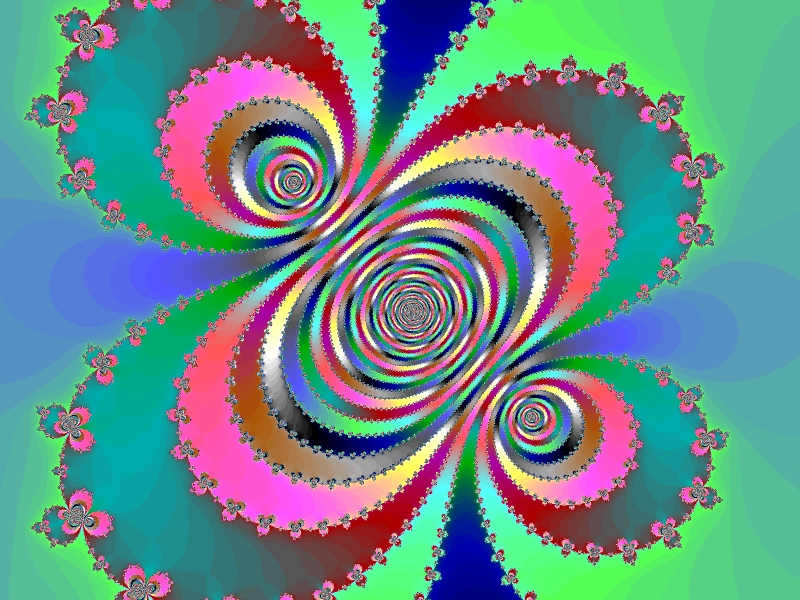
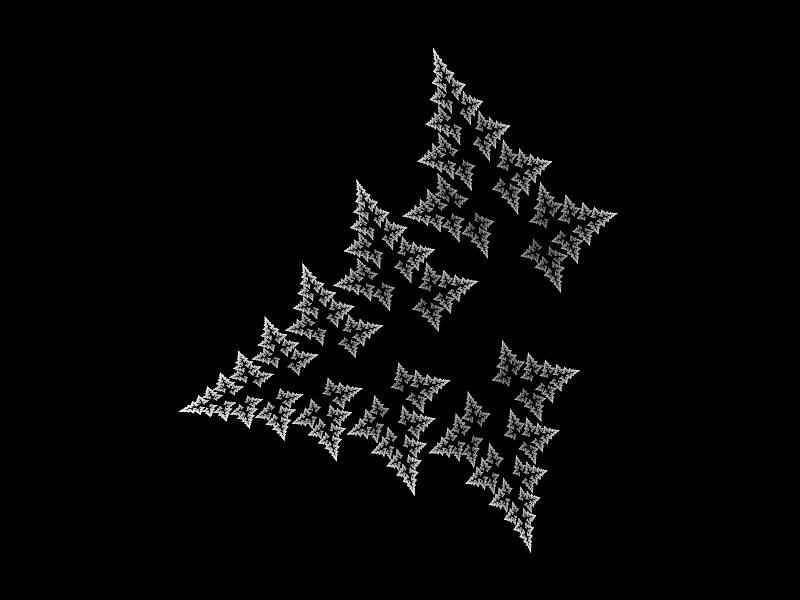
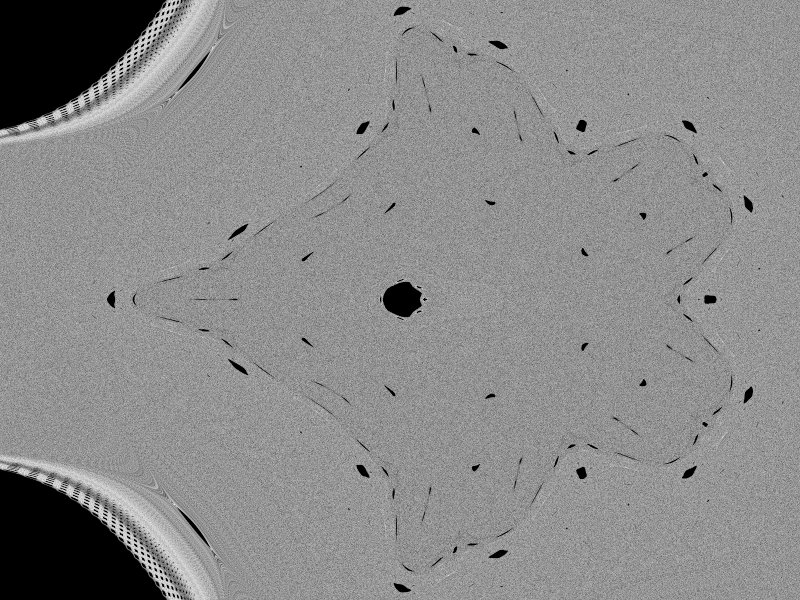
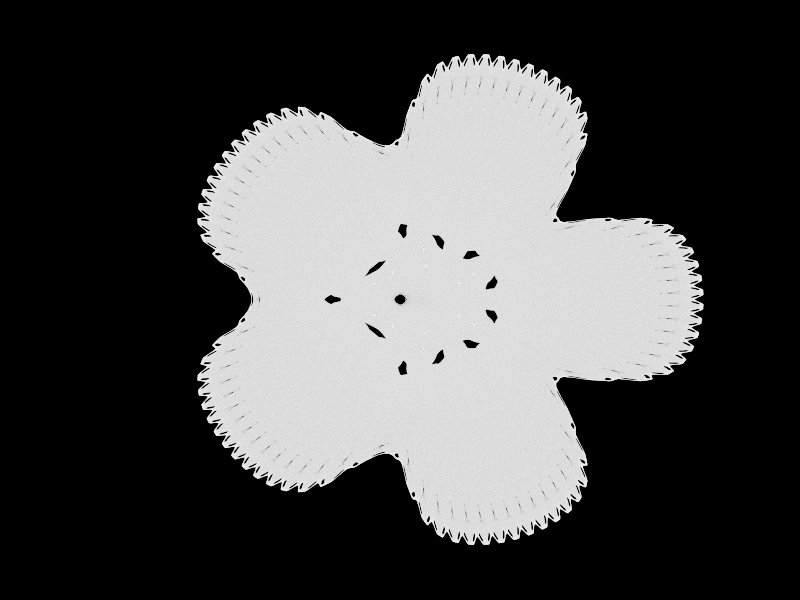
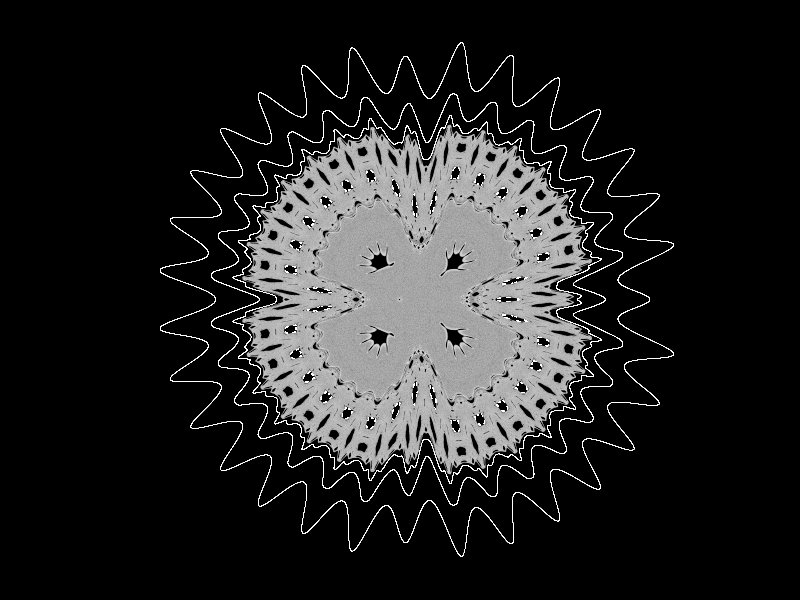
. poses some additional problems - the attractor isn't bound by any circle of finite radius about the origin so it's more difficult to tell when a point escapes and when it is convergent but just currently very far out. Clearly some further thought is necessary to plot such fractals accurately - perhaps there are other escape conditions which would work for these.