This is a post I made on sci.fractals recently (it didn't get any replies there though).
I've been playing about with drawing escape time fractals using different formulae. I've noticed that some formulae give images which seem to have a strange feature - in some places it looks like there are two overlapping images, with one image showing through in areas of the other.
For example, here is an image I made using the formula
z <- (z+1)*(z+c)*(z+i)
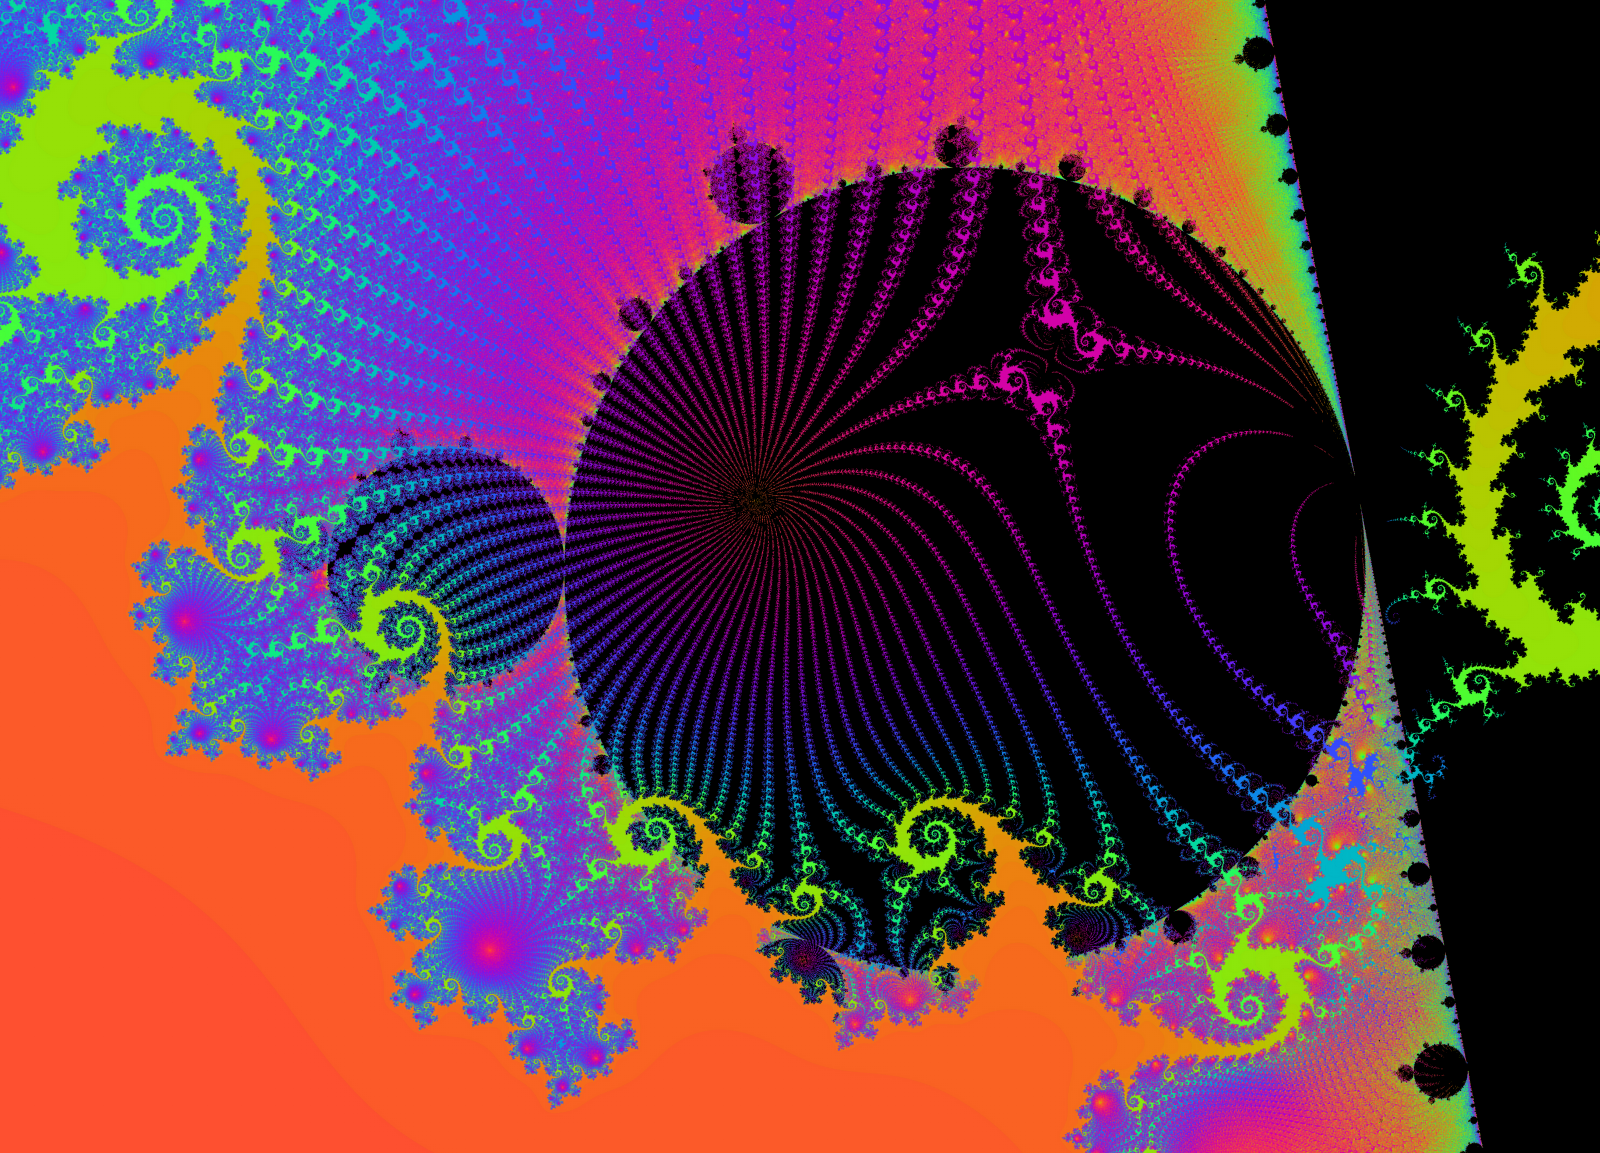
Can anybody help me to understand what is going here? Are there really two iterative process going on hidden in one formula or is it an illusion? Does this phenomenon have a name that I could search for to find out more about it?