Many years ago I wrote a ASCII/ANSI/text-mode design program called SCRDES (for screen designer). It was probably the most sophisticated thing I had ever written at the time - it had many features (circles, lines, rectangles etc.) and little text mode windows that would pop up over your drawing to do things like select different tools and colours and save or load your drawing. I mostly used it for designing levels for my game "Cool Dude".
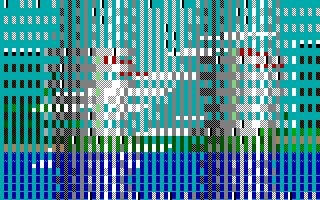
A bug in this program spawned an interesting little puzzle. The bug appeared right after I had added the user friendly interface with the text mode windows. These worked by saving the part of the screen behind the window and restoring it to make the window disappear again. However, the first time I tried to remove a window that was on top of a picture, I got some strange garbage instead of the picture I wanted. For example, the image:
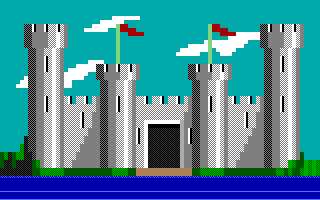
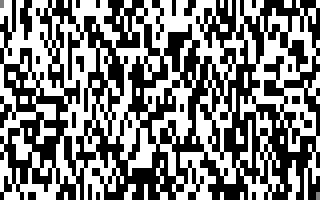
would be turned into this:
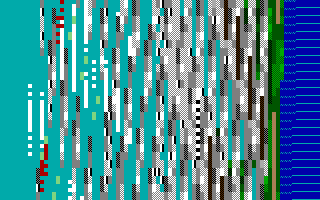
Each time I created and destroyed the window, the garbage changed. I quickly realized that the bug was that I was saving the image into a string one way (scanning horizontally left to right and then top to bottom) and restoring it another way (scanning vertically top to bottom and then left to right). So I was putting back the same data, just in the wrong order.
The patterns in the garbage were interesting, so I wrote another program, called SPRITE (small bitmaps are often called sprites) which took an image and transformed it in this way repeatedly and which could be made to go forwards or backwards. I quickly discovered the following things:
- After a certain number of iterations in one direction, the picture becomes the same as the original. This number depends on the dimensions of the picture. A square picture, for example 8x8 or 25x25, would be restored to the original after only 2 iterations but anything more complicated takes many more. The 80x25 castle image above takes 999 iterations to return to the original.
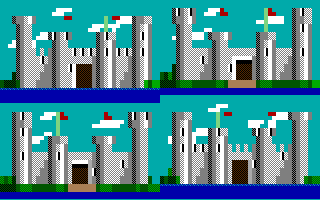
- Some of the intermediate images consisted of smaller copies of the original arranged in a rectangular grid:
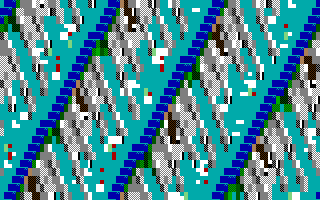
Sometimes these smaller images would be upside-down, sideways, or even diagonal (straddling the edges in a toroidal fashion):
- Sometimes, instead of being shrunk, the image appears to be enlarged and interleaved with the other parts of itself:
After thinking about this for a while one can sort of see why it happens. Consider what happens to the point (1,0). After some number of iterations it will end up at the point (x,y) and the point (2,0) will end up at (2x,2y). The transformation is linear in some sense (modulo the edges) so you get affine transformations of the original image.
To figure out how many iterations it will take to return an x*y image back to its original self, I think one can just consider the trajectory of the point which starts off at (1,0) under the repeated applications of the transformation (a,b)->(⌊(bx+a)/y⌋,(bx+a) mod y) or, equivalently, the point 1 under the transformation c->(c mod y)*x+⌊c/y⌋ - once that ends up back where it started the rest will fall into place by linearity. I think the answer is the multiplicative order of x modulo xy-1, based on some tinkering with the OEIS, but I'm not sure how to go about proving it.
The trajectory can contain every point in the grid (except the top left and bottom right, which remain fixed) but does not necessarily do so. Some grids (for example 78x66) do but some only contain a fraction (<0.5) of the points. Of the 1998 remaining points in the 80x25 grid, for example, half of them are in the trajectory, the white ones in this image:
As you can see, this image is symmetrical under the transformation of rotating by 180° and switching black with white.
The following image was made by looking at all the of the possible grids from 2x2 to 65x65 inclusive, calculating the number of iterations required in each case, dividing by the number of points in the grid minus 2 and converting the resulting fraction into a shade of grey (white=1, black=0). So the white points correspond to grids that take the maximum number of iterations (xy-2), the next most common shade (mid-grey) corresponds to grids that take (xy-2)/2 iterations and so on.
![]()
I ran the program for grids up to 2001x2002 but the resulting image looks pretty homogeneous. White pixels seem to appear more often on lines corresponding to (some) prime numbers, but don't seem to get as rare as quickly as prime numbers do. Rational numbers <0.5 with small denominators seem to be show up more often.
Another open question is, given a x*y grid and a number of transformations n, how many castles will there be in the resulting image and what angles will they be at? (Or, dually, what fraction of a castle is magnified up to the entire sprite?).
Edit 14th July 2013:
This seems to be closely related (although not quite identical) to Arnold's cat map.