A commenter on Friday's post wondered what the picture looks like if you colour different points according to which operations were used. I tried averaging all the operations used first but the image came out a uniform grey (most numbers are made with a fairly homogeneous mix of operations). Then I tried just colouring them according to the last operation used, which worked much better. The following is a zoom on the resulting image, showing just the region where both real and imaginary parts are between -3.2 and 3.2:
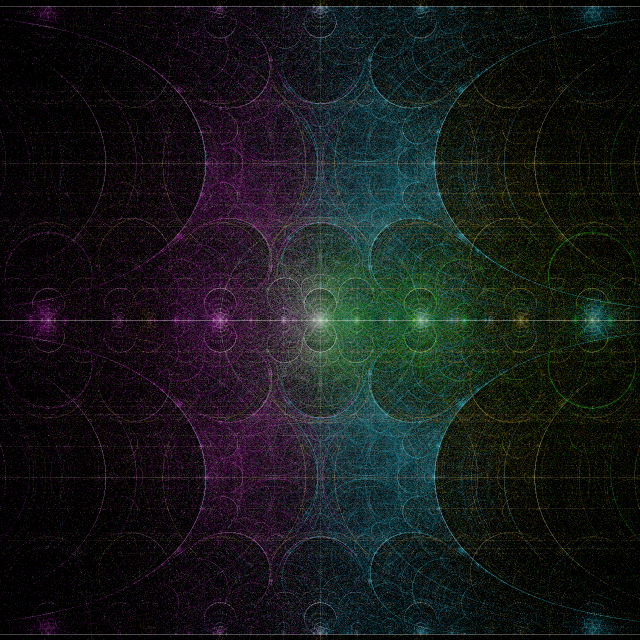
Green is exponential, blue is logarithm, gold is addition and purple is negative. Another nice feature of this image is that you can just about make out the circle of radius 1 centered on the origin.
Having made that image it occurred to me that getting rid of the addition would have a number of advantages. Because addition takes two inputs it sort of "convolves" the image with itself, smearing it out. Also, without addition there is no need to store each number generated (one can just traverse the tree depth first, recursively) meaning that massive quantities of memory are no longer required and many more points can be plotted, leading to a denser, brighter image. Even better, a Monte Carlo technique can be used to make the image incrementally - plotting one point at a time rather than traversing the entire tree. Care is needed to restart from 1 if the value becomes +/-infinity or NaN. Using this technique I plotted about 1.5 billion points to produce this image:
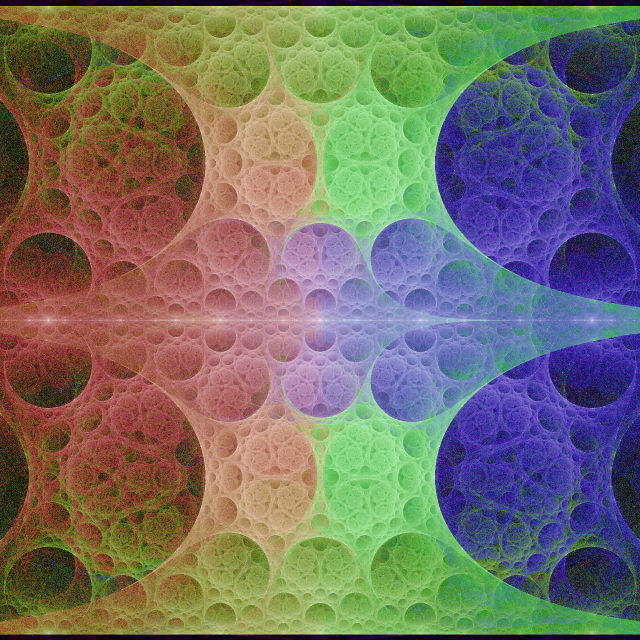
The colour scheme here is blue for exponential, green for logarithm and red for negative. This isn't really a graph of "simple" numbers any more (since it doesn't generate numbers even as simple as 2) but it sure is purty.
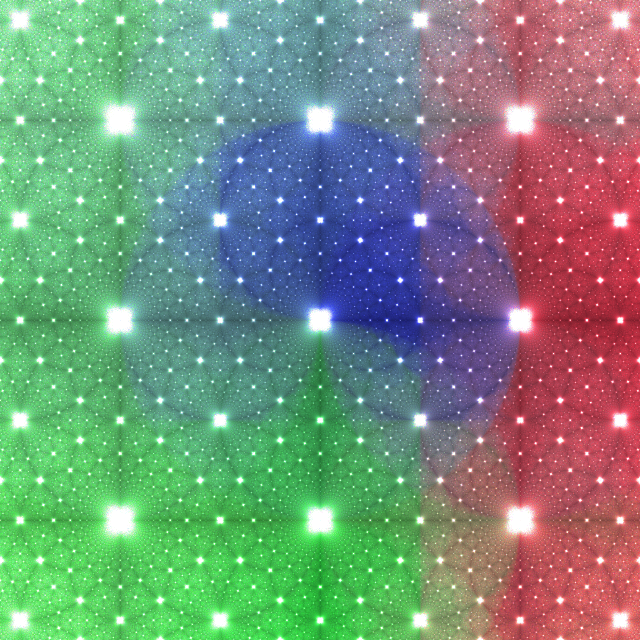
Along similar lines, here is an image generated using the transformations increment (red), reciprocal (blue) and multiplication by i (green) instead of exponential, log and negative. This picks out (complex) rational numbers.
[...] by a program similar to the last two pictures on Monday’s post, but the functions are +sqrt(z), -sqrt(z) and 1+z. Don’t plot a point if the last operation [...]
[...] second image in this post was quite popular, so I decided to make a movie out of [...]
[...] fractal fern-like structure. I was surprised at how different this looked from the second image on this post - while the non-principal branches are not visited very often, they cover a lot of space so make a [...]